
In modern greenhouse cultivation, precision is not just about yield, it’s about sustainability. Optimizing water and nutrient use requires reliable data at the root zone, making substrate sensors indispensable for responsible growers.
However, with several technologies available, choosing the right sensor can feel overwhelming. This guide compares the leading methods and explains why Time Domain Reflectometry (TDR), particularly when enhanced with wireless IoT connectivity, represents the gold standard for sustainable, data-driven horticulture.
Comparison of Substrate Sensor Technologies
1. Gravimetric Method
The Reference Standard
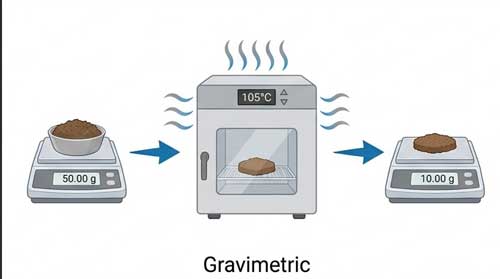
This is the classic “weigh and dry” approach. You take a fresh substrate sample, weigh it, dry it in an oven at 105°C until no further mass loss occurs, and reweigh it. The water content is calculated from the mass difference.
Technical Principle: It measures water content by mass directly, without relying on any electrical or physical proxy.
What It Measures: Gravimetric water content (kg water per kg dry substrate), expressed as a percentage on a mass basis.
Best use case: Servers as a Reference for calibration
Pros
– The only true primary reference standard for water content measurement.
– No sensitivity to salinity, temperature, or substrate texture.
– Requires no calibration, the result is absolute.
Cons
Destructive and labor-intensive
Provides only a discrete snapsho
Completely unsuitable for automated irrigation control.
Time-consuming (drying takes 24–48 hours).
2. Tensiometers
Measuring Water Potential
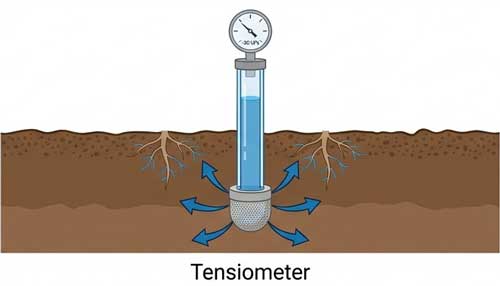
These devices measure soil water tension—the negative pressure (suction) that plant roots must exert to extract water from the substrate.
Technical Principle: A tensiometer consists of a water-filled tube with a porous ceramic cup at the bottom and a vacuum gauge at the top. As the substrate dries, it draws water out of the ceramic cup, creating a vacuum within the sealed tube. This vacuum (measured in centibars or kPa) directly indicates how tightly water is bound to the substrate particles.
What It Measures: Soil water matric potential (suction tension), expressed in kPa or centibars. This is an energy measurement, not a volume measurement.
Best Use Case: Mineral Soils near field capacity
Pros
Provides direct insight into plant-available water (the energy status), which is biologically relevant.
Measures the actual force plants must overcome to extract water.
Performs well in mineral soils near field capacity.
Cons
Requires regular maintenance: must be refilled with deionized water and purged of air bubbles.
Limited measurement range (0 to ~85 kPa); fails in dry or very wet conditions.
Performs poorly or fails entirely in inert, coarse substrates like rockwool, perlite, or coco coir, where capillary forces are insufficient.
Slow response time to rapid moisture changes.
Can be damaged by freezing.
3. Capacitance Sensors
Measuring Dielectric Permittivity via Frequency
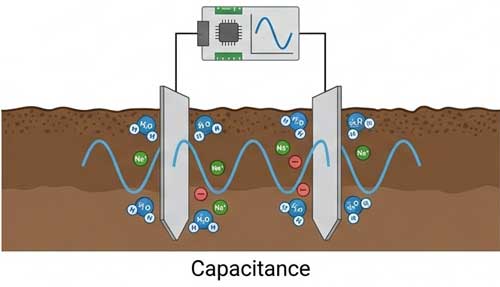
These sensors measure the dielectric constant of the substrate to infer water content, as water has a much higher dielectric permittivity (~80) than air (~1) or dry substrate solids (~3–5).
Technical Principle: Capacitance sensors consist of two electrodes that act as a capacitor, with the substrate acting as the dielectric medium. The sensor charges the capacitor at a specific frequency (typically 10–50 MHz) and measures the time required to reach a target voltage. This charging time is directly proportional to the dielectric permittivity. In practice, the sensor outputs a raw capacitance value, which is then empirically converted to Volumetric Water Content (VWC).
What It Measures: Apparent dielectric permittivity at low frequency, indirectly converted to VWC (%).
Best use Case: Low-Budget, Non-critical operation
Pros
Inexpensive and widely available.
Provide rapid response and continuous real-time data.
Low power consumption, suitable for battery-operated devices.
Cons
Very high susceptibility to salinity (EC): High salt concentrations cause signal attenuation (loss tangent), leading to significant overestimation of water content. The sensor essentially “sees” ions as water molecules.
Highly temperature-sensitive; readings drift with substrate temperature changes.
Require substrate-specific calibration that shifts as the substrate ages, compacts, or changes in organic matter content.
Known for long-term signal drift, requiring frequent recalibration that most growers cannot perform accurately in situ.
Poor accuracy in high-clay or high-salinity substrates.
4. Time Domain Reflectometry (TDR)
The Precision Method
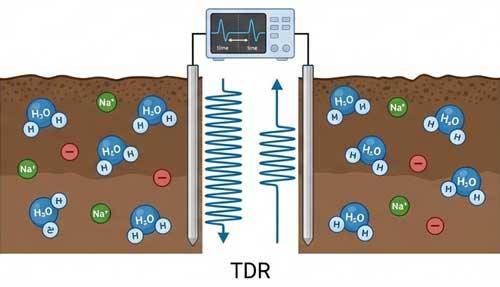
TDR sensors measure the propagation time of an electromagnetic pulse along steel waveguides (rods) inserted directly into the substrate.
Technical Principle: A TDR device generates a fast-rise-time voltage step (with frequencies in the GHz range). This pulse travels down a transmission line to the sensor rods, reflects at the end of the rods, and returns to the device. The travel time (Δt) is measured with picosecond resolution. Since the velocity of the pulse is dictated by the square root of the apparent dielectric permittivity (ε) of the surrounding medium (v = c/√ε), and water has an extremely high ε (~80), the travel time is overwhelmingly determined by water content. The relationship is given by Topp’s equation (or similar polynomial calibrations), which correlates the apparent dielectric constant (K_a = [c·Δt/(2L)]²) directly with Volumetric Moisture Content (VMC) with remarkable accuracy.
What It Measures: Apparent dielectric permittivity at GHz frequency, directly converted to VMC (%).
Best Use Case: High-Precision, irrigation automation, long-term monitoring
The Technology behind the J-Tec Sensor
Pros
Virtually immune to salinity and EC interference because the high-frequency (GHz) signal is magnetically coupled, not conductively coupled. The pulse velocity is unaffected by ionic concentration in the pore water.
Excellent accuracy, correlating with gravimetric reference at R² > 0.98 in peer-reviewed studies.
Requires minimal to no substrate-specific calibration; Topp’s universal equation works across a wide range of mineral and organic substrates.
Exceptional long-term stability with virtually zero sensor drift.
Temperature-stable compared to capacitance sensors.
Robust and maintenance-free; no consumables or refilling required.
Suitable for all substrate types, including inert hydroponic media (rockwool, perlite, coco coir).
Cons
Higher initial cost compared to capacitance sensors (but offset by longer lifespan and reduced maintenance).
More complex electronics require careful manufacturing quality control.
Slightly higher power consumption during the measurement pulse (though negligible for LoRa-based systems with long battery life).
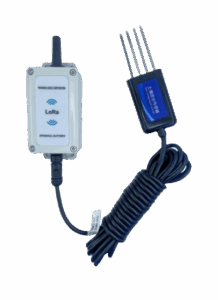
Comparison Table of Substrate Sensor Technology
| Technology | What It Measures (Physical Quantity) | Output Unit | Susceptibility to Salinity (EC) | Maintenance | Best Use Case |
| Gravimetric | Mass of water per mass of dry substrate | % Water Content (mass basis) | None (direct measurement) | High (lab work) | Calibration reference |
| Tensiometer | Soil water tension (matrix potential / suction pressure) | kPa or centibars | Low (mechanical) | High (refilling) | Mineral soils near field capacity |
| Capacitance | Dielectric permittivity at low frequency → indirectly VWC | VWC (%) or raw capacitance | Very High (signal attenuation) | Medium (recalibration) | Low-budget non-critical monitoring |
| TDR (j-Tec) | Dielectric permittivity at GHz frequency → directly VMC | VMC (%) (Volumetric Moisture Content) | Virtually None (GHz range) | Very Low (maintenance-free) | High-precision, automated, saline or inert substrates |
Understanding the Critical Difference: VMC vs. VWC
You will notice that both capacitance and TDR sensors ultimately report a percentage of water in the substrate. However, the terms VMC (Volumetric Moisture Content) and VWC (Volumetric Water Content) are often used interchangeably in practice—both refer to the volume of water per total volume of substrate (e.g., 35% means 35 mL of water per 100 mL of substrate).
The real difference is not in the output unit, but in how reliably that percentage is derived:
- Capacitance sensors measure a low-frequency electrical property (charge time) that is also heavily influenced by dissolved salts (EC). When your fertilizer strength changes, the sensor’s raw signal shifts, and the calculated VWC drifts—even if the actual water volume has not changed. You are essentially measuring a mixture of water and ions, which makes the VWC output ambiguous.
- TDR sensors, by contrast, measure a high-frequency electromagnetic travel time that is physically dominated by the dielectric permittivity of pure water molecules. The salt ions in the pore water do not affect the pulse velocity. Therefore, the derived VMC value is a truer, more stable representation of the actual water volume in the root zone—regardless of your irrigation strategy or substrate salinity levels.
In short: Both output a percentage, but only TDR gives you that percentage with scientific integrity across changing EC and temperature conditions.
When to Recommend Which Technology
- For Calibration or Occasional Audits: The gravimetric method remains indispensable as a check standard.
- For Hydroponic or Inert Substrates (Rockwool, Perlite): Avoid tensiometers entirely, as they cannot generate a reliable vacuum in these high-porosity materials.
- For Low-Budget, Non-Critical Monitoring: Capacitance sensors may suffice, but expect data drift with changing EC and temperature—requiring frequent recalibration that most growers cannot perform in situ.
- For Data-Driven, Sustainable Cultivation: TDR technology is the unequivocal choice. Its scientific robustness, long-term zero-drift stability, and insensitivity to salinity make it the only sensor class suitable for closed-loop automated irrigation systems and peer-reviewed research.
j-Tec’s 2-in-1 and 4-in-1 TDR Solutions
We, at j-Tec, have chosen TDR as the core technology for our sensors because it represents the best balance of scientific rigor and operational reliability. We understand that superior data is the foundation of sustainable greenhouse management.
Our 2-in-1 Sensor combines TDR-based substrate moisture measurement (VMC) with a temperature sensor. For comprehensive monitoring, the 4-in-1 Sensor adds electrical conductivity (EC) for nutrient availability and pH for substrate acidity, all built on the same highly accurate TDR platform.
Both sensors are based on LoRaWAN, a low-power, long-range wireless protocol. This design provides significant advantages:
- Ease of Installation & Scalability: LoRa’s long-range capability means fewer gateways are needed, making it easy to monitor a single greenhouse or scale up to an entire complex.
- Reliability: Industrial LoRa sensors offer high stability and battery life measured in years, ensuring dependable operation without constant intervention.
- Smart Agriculture Integration: LoRa sensors are perfect for automated systems, allowing for real-time data visualization, set-point-controlled irrigation, and historical data analysis.
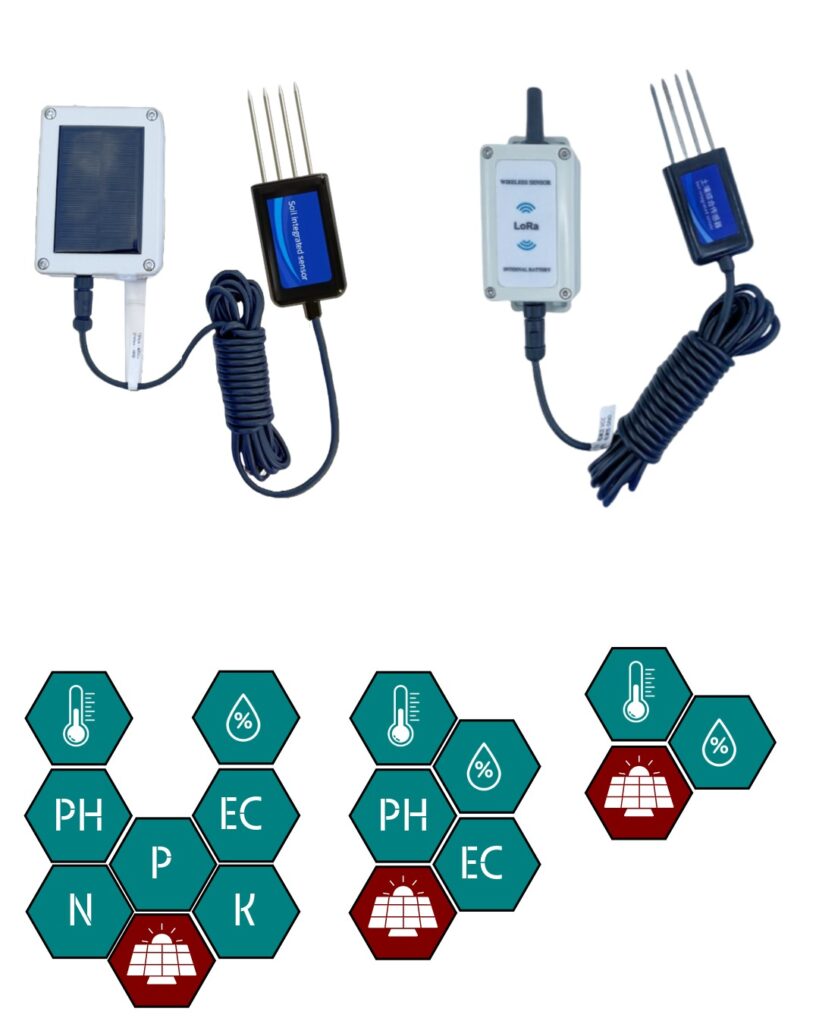
Where to Use This Type Best
The j-Tec 4-in-1 sensor is ideally suited for:
- High-Value Horticultural Crops: Precisely managing the water, EC, and pH levels for produce like tomatoes, cucumbers, or berries is critical for maximizing brix, color, and marketable yield.
- Research Environments: The scientific accuracy of TDR is essential for trials where robust, reproducible data is paramount.
- Automated Irrigation Systems: For growers committed to water and nutrient efficiency (reducing leachate by 20–30%), our sensor provides the trustworthy, high-frequency input needed to automate irrigation with confidence.
Conclusion
For sustainable greenhouse cultivation, the choice of substrate sensor is a strategic one. While several technologies exist, TDR stands out for its scientific accuracy and reliability. By integrating this robust sensing technology with the connectivity and convenience of LoRaWAN, j-Tec empowers growers to cultivate smarter, more efficiently, and more sustainably.
References
Richardson, M. D., Meisner, C. A., Hoveland, C. S., & Karnok, K. J. (1992).
Time Domain Reflectometry in Closed Container Studies.
Agronomy Journal, 84(6), 1041-1045.
https://doi.org/10.2134/agronj1992.00021962008400060022x
Topp, G. C., Davis, J. L., & Annan, A. P. (1980).
Electromagnetic Determination of Soil Water Content: Measurements in Coaxial Transmission Lines.
Water Resources Research, 16(3), 574-582.
https://doi.org/10.1029/WR016i003p00574
Hanson, B. R., & Peters, D. (2000).
Soil Moisture Sensors: A Comparison of TDR, Capacitance, and Tensiometer Technologies.
University of California Cooperative Extension, Publication 8082.
https://anrcatalog.ucanr.edu/pdf/8082.pdf
Jones, H. G. (2004).
Irrigation Scheduling: Advantages and Pitfalls of Plant-Based Methods.
Journal of Experimental Botany, 55(407), 2427-2436.
https://doi.org/10.1093/jxb/erh213
LoRaWAN Specification v1.0.4 (2020).
LoRa Alliance Technical Specification for Low-Power Wide-Area Networks.
https://lora-alliance.org/resource-hub/lorawan-specification-v1-0-4/
Nemali, K. S., & van Iersel, M. W. (2006).
Water Use and Growth of Potted Plants Under Different Irrigation Scheduling Methods.
Acta Horticulturae, 718, 505-512.
https://doi.org/10.17660/ActaHortic.2006.718.59
Thompson, R. B., Gallardo, M., & Ferreyra, R. (2010).
Substrate Moisture and EC Monitoring in Greenhouse Vegetable Production.
ISHS Acta Horticulturae, 893, 901-908.
https://doi.org/10.17660/ActaHortic.2010.893.98
Seeed Studio SenseCAP (2023).
Industrial LoRaWAN Soil Moisture and Temperature Sensor Product Datasheet. https://wiki.seeedstudio.com/SenseCAP-Soil-Moisture-Temperature-pH-EC-Sensor/
Why Monitor Temperature and Humidity in Greenhouses? Benefits Explained
Greenhouse cultivation often still rely on intuition or simple thermostats...
Smart Irrigation: How Soil Moisture Monitoring Reduces Water Use and Costs in Agriculture
Water scarcity is increasingly shaping the way farmers manage their...
